Surrogate Trust Audit
When Can We Trust a Neural PDE Surrogate?
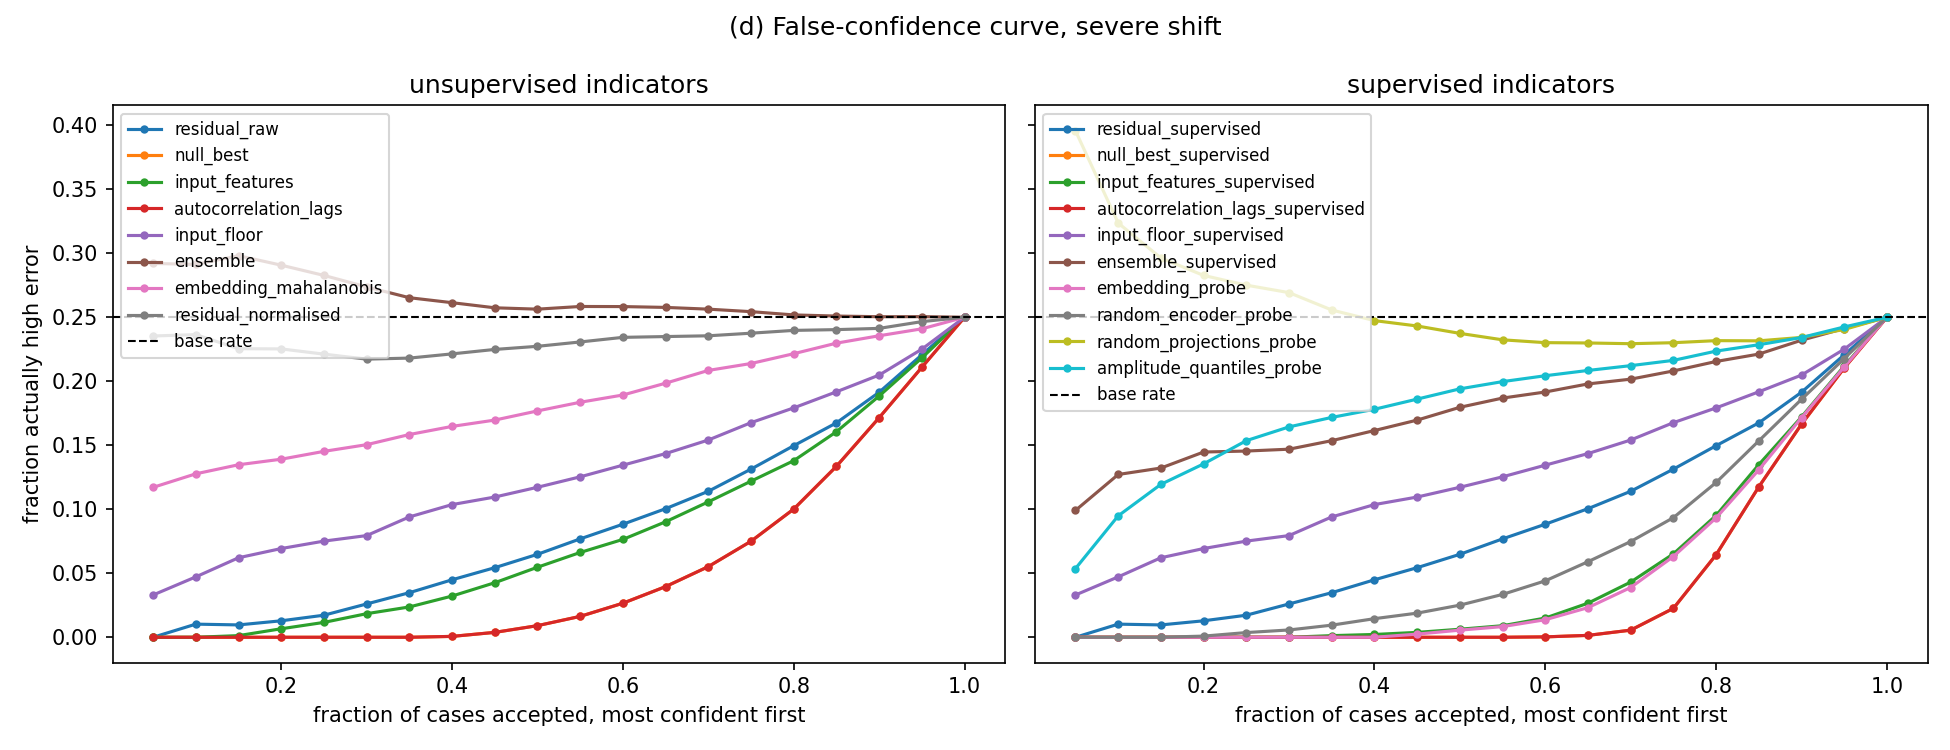
All three trust indicators lost to an input-only null model on the six most shifted cells, with margins of -0.286, -0.694 and -0.077 and every interval below zero.
Preprint. S. Singh, 2026. Code and full audit trail are public. Not peer reviewed.
The finding
Partial differential equations describe how physical things change: heat spreading, fluid moving, a wave travelling. Solving them properly is slow, so people train a neural network to stand in for the solver. It is much faster, and sometimes it is wrong in ways the output does not show.
Three signals are meant to tell you when to stop trusting it: the PDE residual of the surrogate’s own rollout, disagreement across a seed ensemble, and a frozen-feature embedding probe borrowed from the interatomic-potential literature.
Before running the grid I registered the comparison I would judge all three against: a null model of matched capacity that sees only the input, and never sees the physics, the residual or the solver. On the six most shifted cells, all three indicators lost to it, and every confidence interval sat below zero.
Why it matters
A null model is a deliberately unintelligent baseline. If it matches your clever method, the clever method is not using the information you think it is.
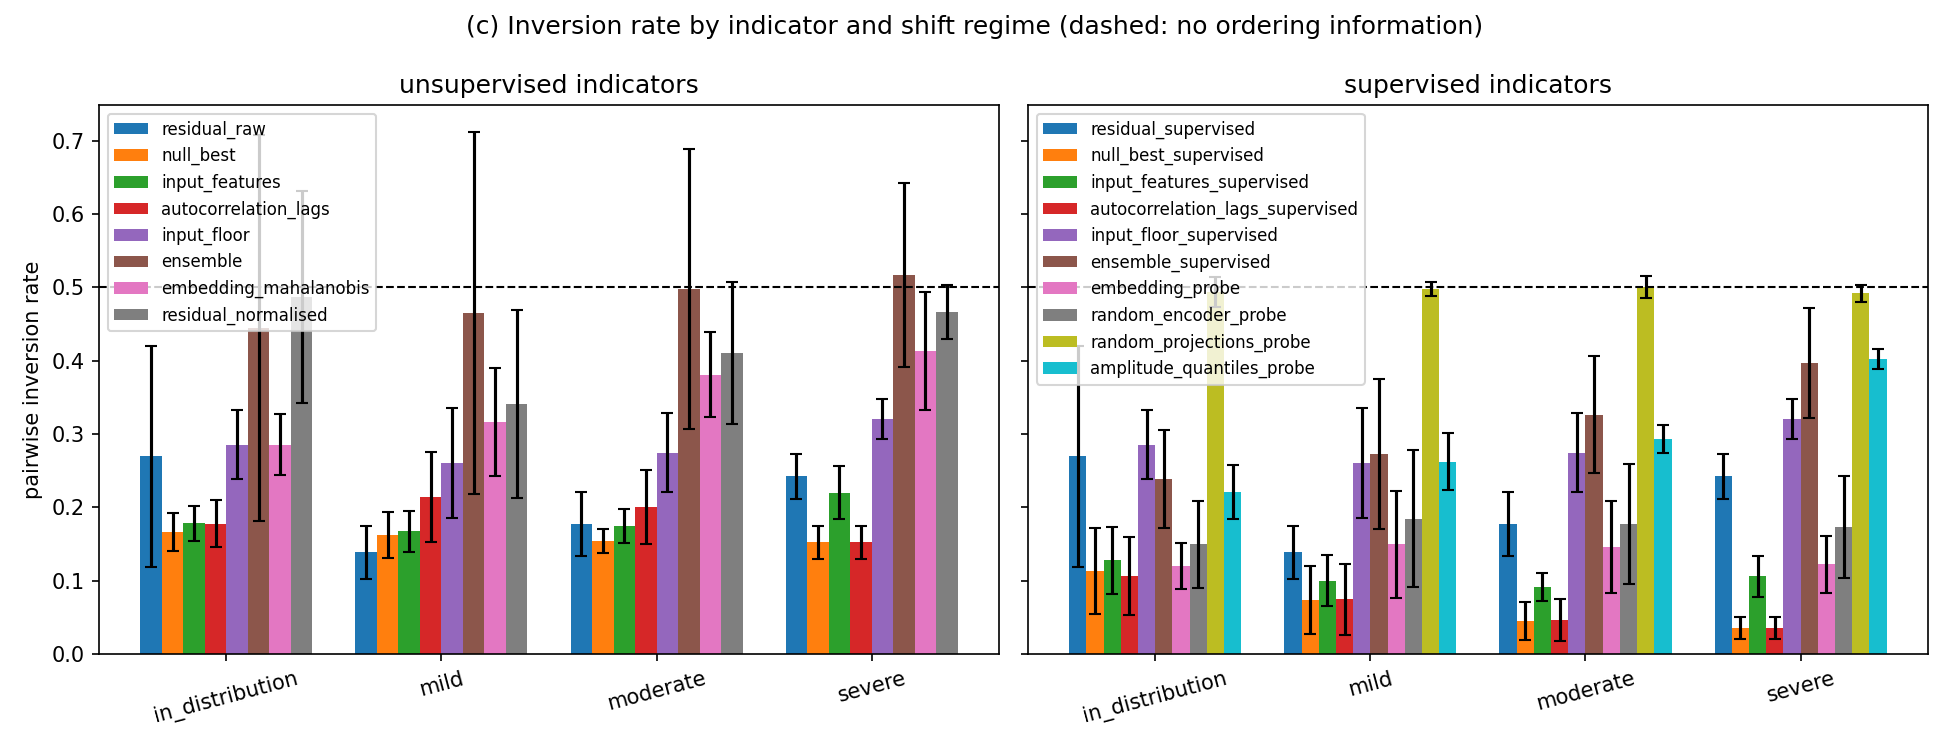
Losing to an input-only null means these indicators are largely reading which inputs tend to be hard, not detecting that this particular prediction is wrong. That is a real pattern, and it is useful, but it is a prior dressed up as a diagnosis.
Registering the null first is what makes that statement clean. Chosen afterwards, I would have picked a weaker baseline without noticing I was doing it.
Method
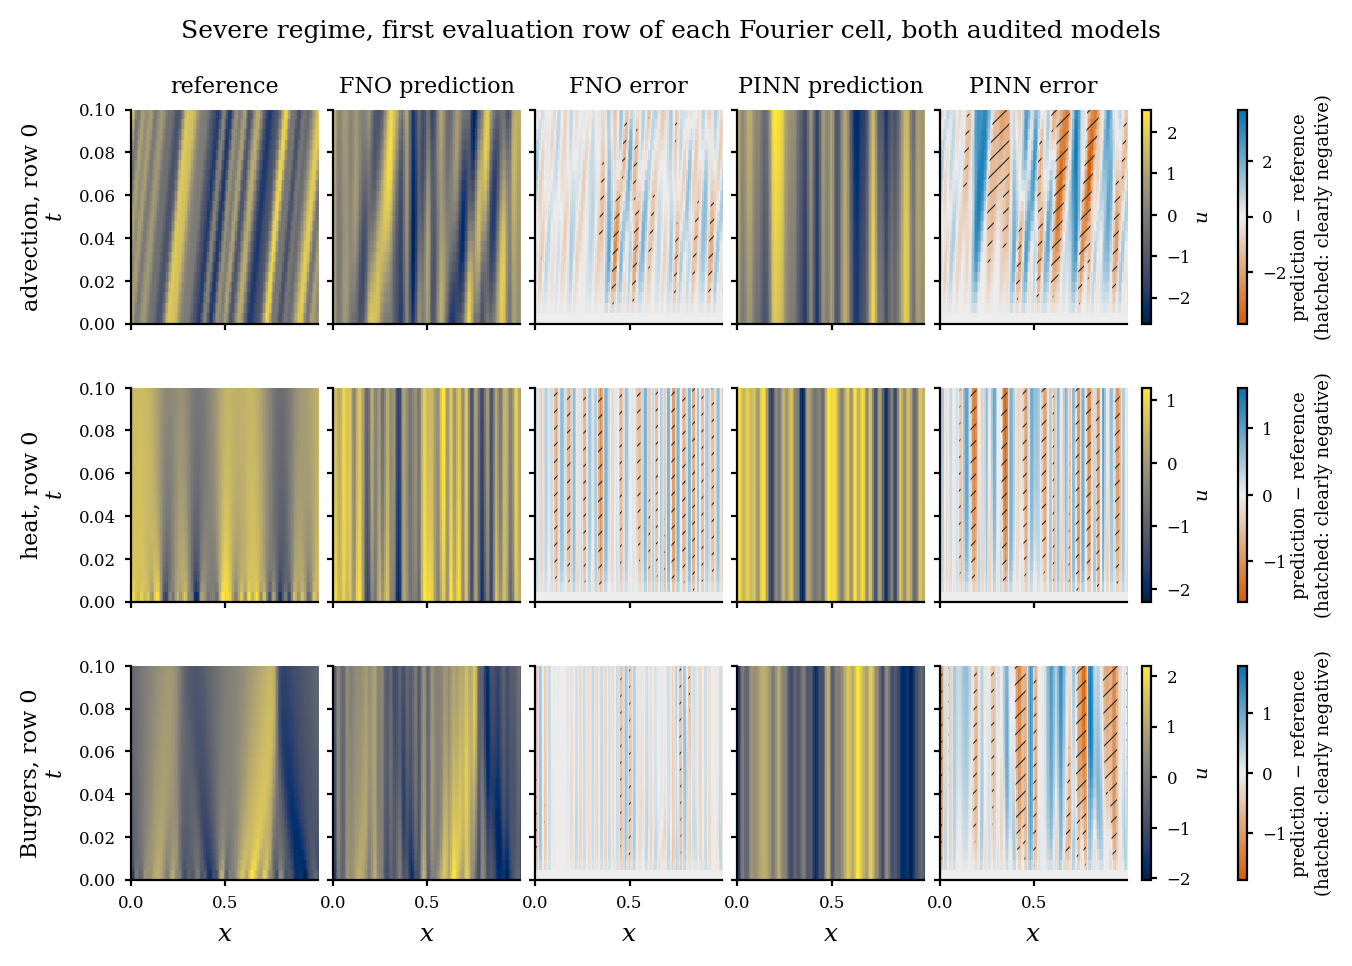
Three PDE families, advection, heat and Burgers. Two architectures, an FNO and a PINN. Six regimes running from in-distribution out to severe shift. That is 36 cells, each with 1,360 test samples.
The whole study rests on the true error being worth measuring against, so every solver was verified first.
Results
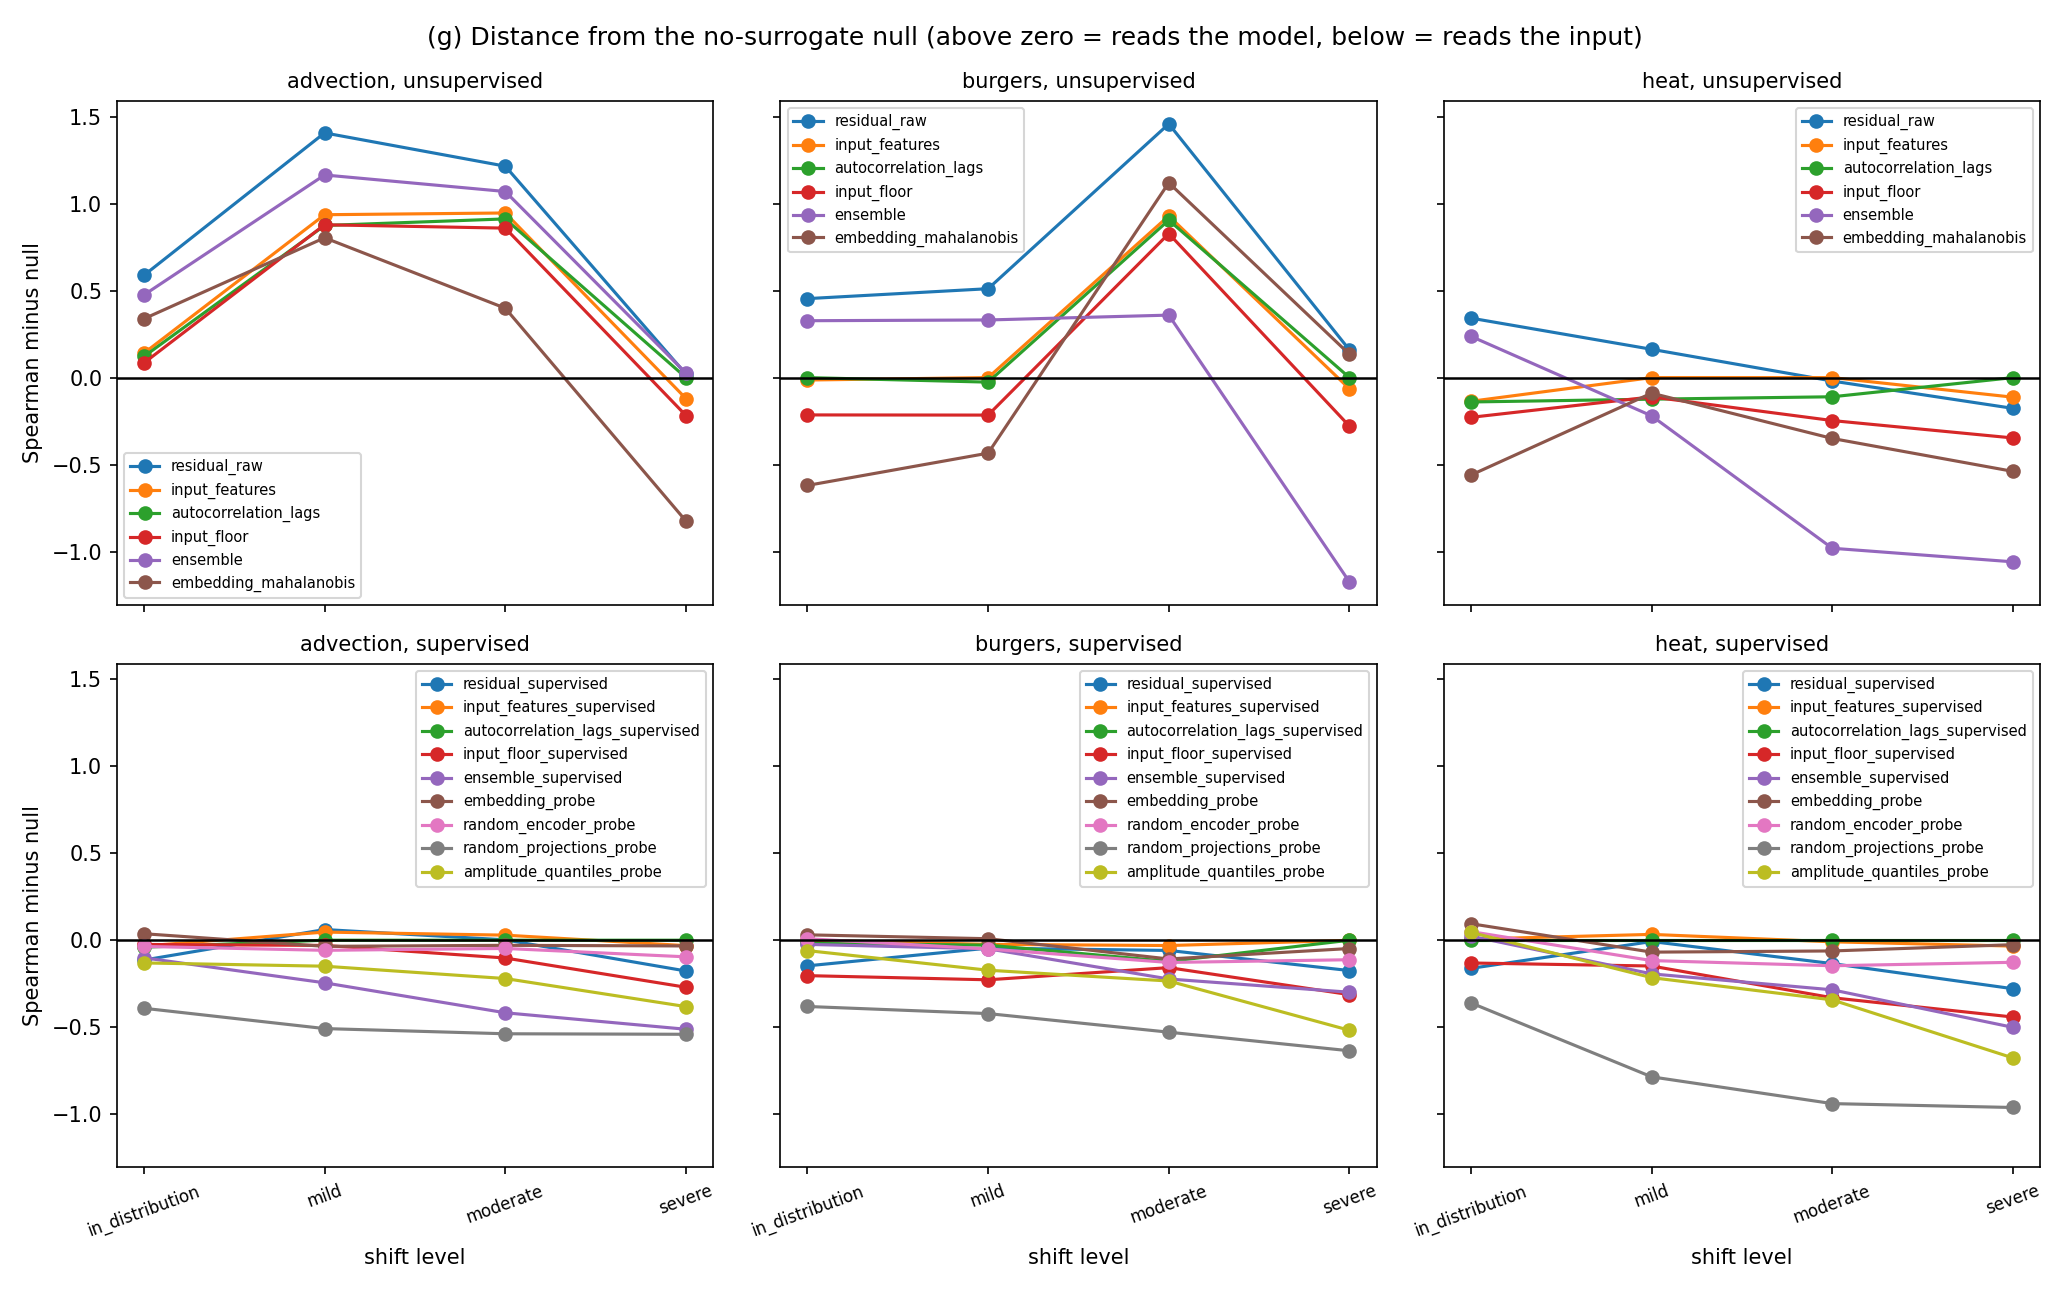
The preregistered test compares each indicator class against the null on the six most shifted cells. All three return the same verdict, recorded in the results table as “fails: null better”:
The PDE residual loses by 0.286, with a 95% interval from -0.333 to -0.235. Seed-ensemble disagreement loses by 0.694. The embedding probe, the closest of the three, still loses by 0.077 with an interval from -0.119 to -0.043.
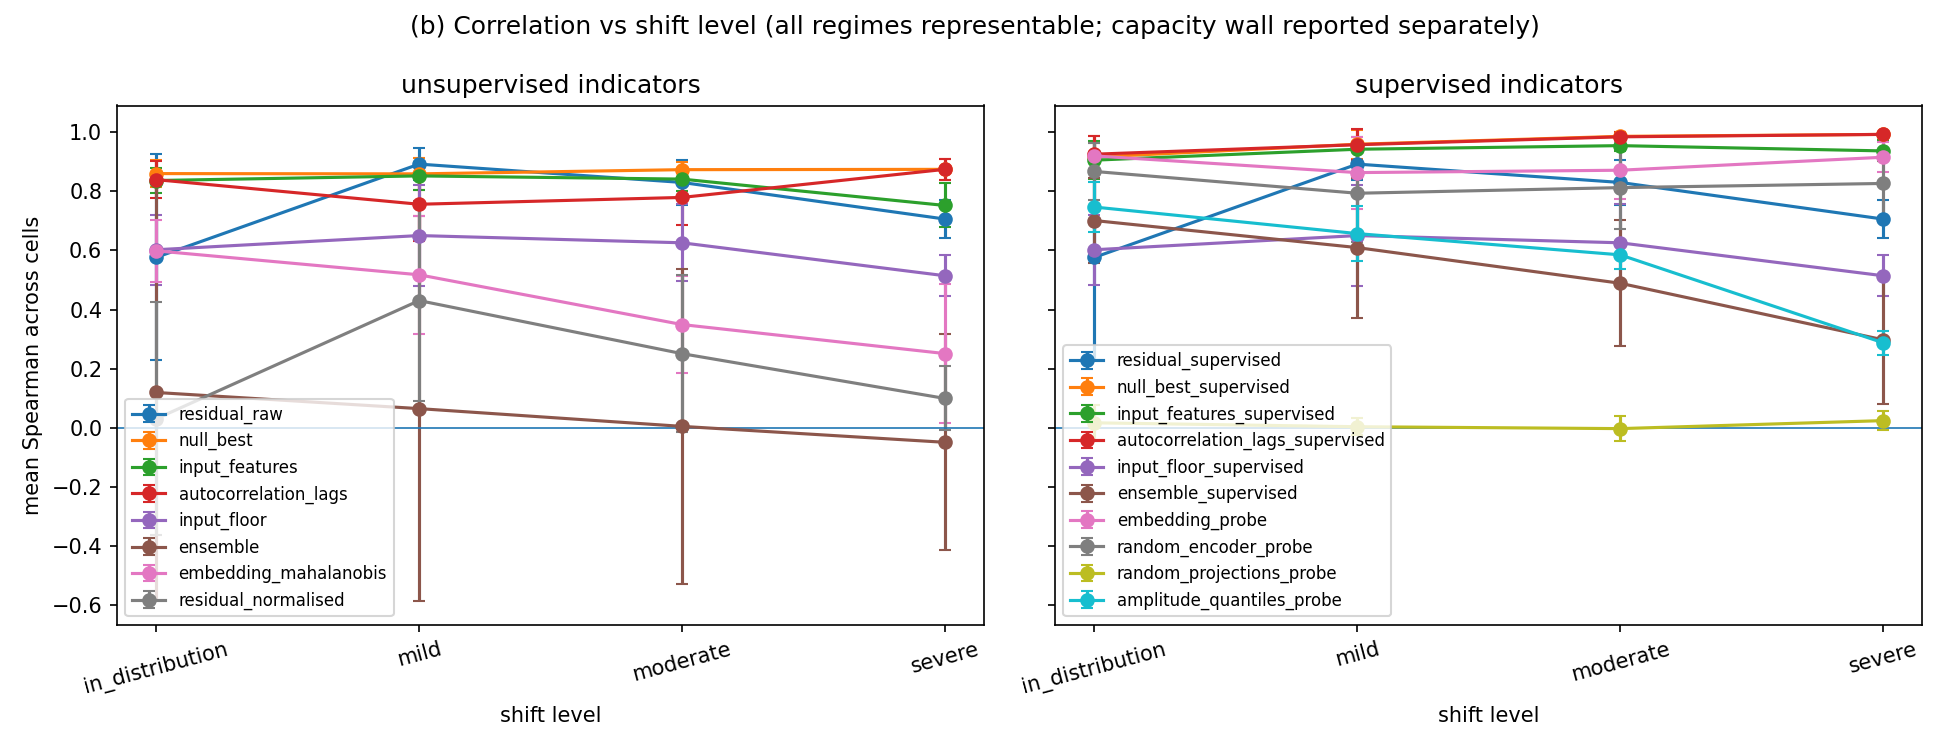
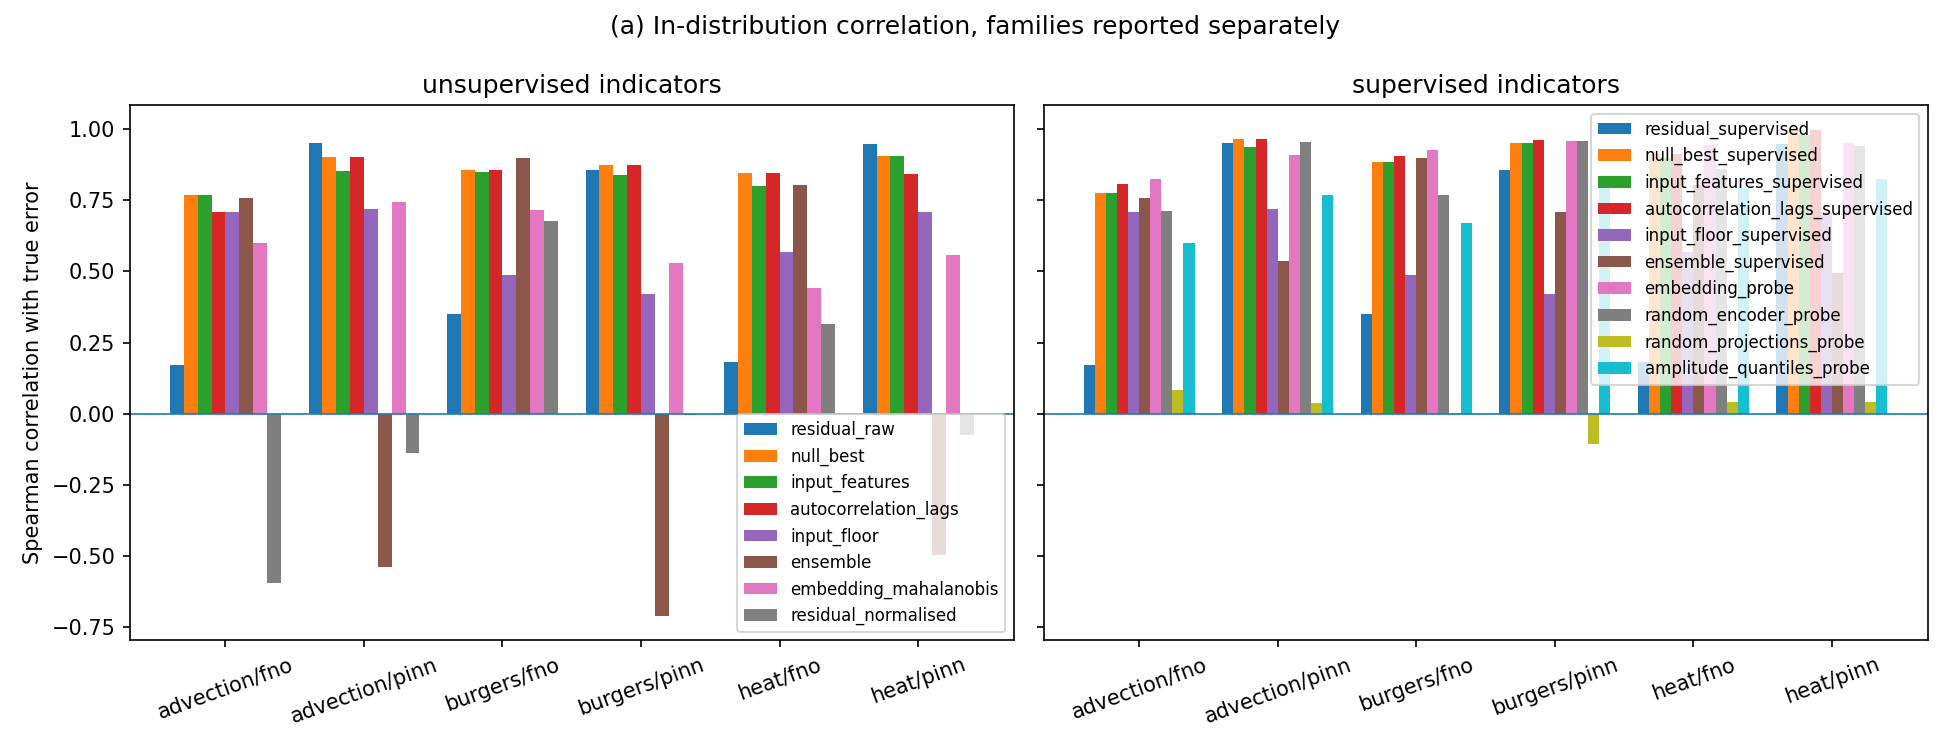
Measured without shift, the same indicators look useful, which is why the shifted case is the one worth testing.
What I checked that could have broken it
The true error is only meaningful if the reference solvers are right, so each one was refined on a grid and its convergence order measured against the order the scheme should have. All four passed inside a tolerance of 0.15: upwind at 0.993 against an expected 1.0, Lax-Wendroff at 2.000, Crank-Nicolson at 2.000, and the Burgers spectral scheme at 1.956.
The Burgers convergence study uses an exact Cole-Hopf solution rather than a fine-grid rerun of the same scheme, because comparing a scheme against itself cannot see an error it makes consistently.
The harder problem is on the surrogate side, and it limits the result rather than supporting it. The PINN barely learns: measured against simply predicting no change at all, its validation error averages 0.957, where 1.0 would mean it learned nothing useful. The FNO, by comparison, sits at 0.0002. Half of the confirmatory cells therefore describe a model close to the identity map, and I report that rather than dropping those cells.
Limits
The PINN trainability problem above is the largest one. With half the confirmatory cells describing a model at or near the identity map, the confirmatory comparison is weaker than the cell count suggests.
“Reference-free” is not quite true of the embedding probe, which is fitted on data that the deployment setting would not have.
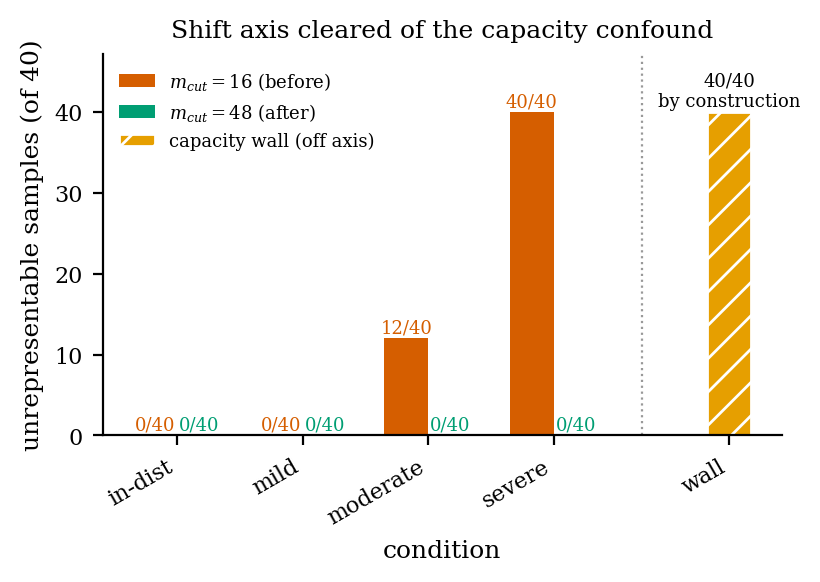
The residual indicator’s noise floor is tied to the same axis as the shift, so part of what it tracks is the regime rather than the error.
Three PDE families at one resolution and one width. Nothing here says the same holds for larger surrogates, other equations, or operator learning at scale.
From the Rigor Log
The test was wrong and the solver was right
FirstA test asserted that the residual of an exact reference step stays below 1e-3. It measured 5.3e-3, so the solver looked broken.
SecondRefinement showed the residual falls by exactly 4.00x per halving of the timestep, which is second-order convergence. I derived the closed-form law it should follow and it matched to within 1%: predicted 3.95e-3 against 3.9625e-3 measured. The solver was right and my threshold was a number with no theoretical basis.
REPORT.md, section 2.4
The deliberately dumb baseline beat everything
FirstTrust signals for a neural PDE surrogate, a fast learned stand-in for a physics solver, looked like they were detecting when the surrogate was wrong.
SecondA matched-capacity null model that sees only the input, registered as the primary comparison before any results, beat every trust signal tested.
PREREGISTRATION.md and results/tables/
A float32 wavenumber hiding inside a float64 field
FirstSpectral derivatives looked fine at a loose tolerance, and the field was float64 throughout.
SecondA test at a 1e-10 tolerance in float64 failed. torch.fft.rfftfreq follows the default dtype, so it handed back float32 wavenumbers even for a float64 field, and squaring them cost two significant digits.
REPORT.md, section 2.2
Files
The result artefacts these pages are built from. Every number above is read from one of these.
- tables/primary_h4.csvThe preregistered confirmatory test: margin against the null, with intervals883 B
- tables/h4_unsupervised_reported.csvThe same comparison for the unsupervised family, reported not confirmatory657 B
- tables/indicator_summary.csvSpearman, Pearson and inversion rate per cell and indicator, with bootstrap intervals434 KB
- tables/solver_verification.csvObserved convergence order per solver against the expected order274 B
- tables/trainability.csvValidation error against a no-change baseline, per architecture and seed4 KB
- tables/null_member_disagreement.csvSpread between null model members669 B
- indicator_scores.csvEvery indicator score for every evaluation sample60.8 MB
- run_manifest.jsonCell list, test size and code fingerprint3 KB
- environment.txtPinned package versions the grid ran under963 B
- tables/PROVENANCE.mdHow each table was produced1 KB
Stack
- PyTorch
- FNO
- PINN
- NumPy
- SciPy
- pytest